Tornadoes: Science, Safety & Spotting
What Is a Tornado?
A tornado is a violently rotating column of air that extends from a thunderstorm down to the ground, often visible as a funnel or tube of cloud, dust, and debris. Tornadoes can produce some of the strongest winds on Earth, capable of severe damage in a matter of seconds.
Most tornadoes are associated with severe thunderstorms and form in environments with strong instability, wind shear, and focused lift along fronts, drylines, or other boundaries. They can occur at any time of the day or year, but many regions see peak activity in the spring and early summer during the late afternoon and evening.
Training: Tornado Science & Storm Evolution
Scroll through the StoryMap below to learn about the science behind tornadoes and the evolution of the storms that produce them.
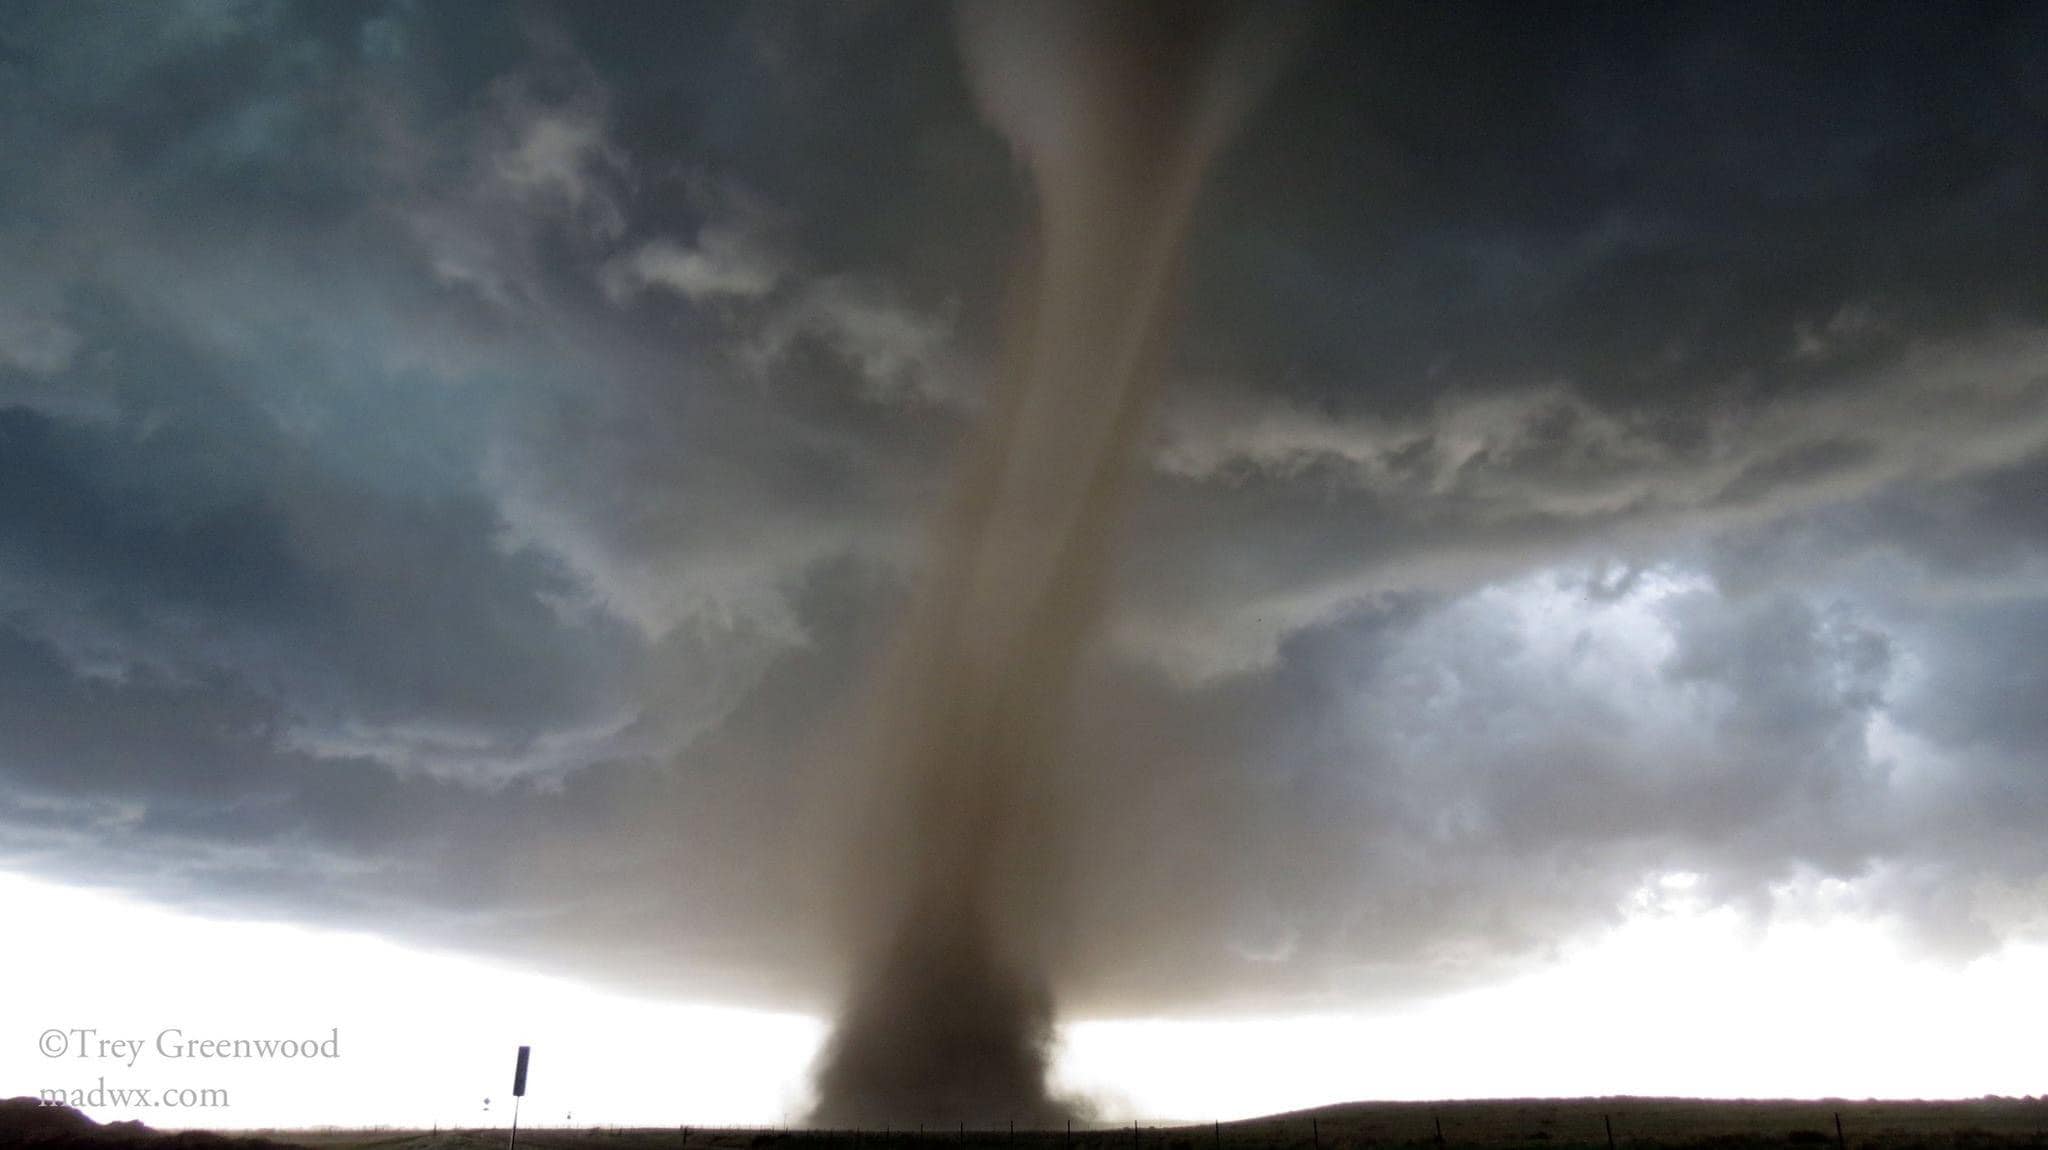
Wray, CO. May 7, 2016
Picture by Trey Greenwood
Next, scroll through the StoryMap from NWS New York, NY for a comprehensive look at a severe weather outbreak near Montgomery, New York, on August 27, 2020. This storm produced multiple EF1 tornadoes.
Tornado Basics & Key Terms
Understanding basic tornado terminology helps both the public and spotters interpret warnings and communicate what they see. These concepts are also important for building an effective safety plan at home, school, or work. [web:5]
- Funnel cloud – A rotating, funnel‑shaped cloud extending from the base of a thunderstorm that has not reached the ground.
- Debris cloud – A rotating cloud of dust or debris at ground level; when seen beneath a rotating funnel or wall cloud, it confirms a tornado.
- Wall cloud – A persistent, lowered cloud base beneath the rain‑free base of a thunderstorm, often on the south or southwest side of the storm; rotating wall clouds are a classic precursor to tornado development.
- Tornado warning – Issued when a tornado is imminent or occurring, based on radar signatures or reliable spotter reports. [web:5]
- Tornado watch – Issued when conditions are favorable for tornadoes and severe thunderstorms across a broader area. [web:5]
How Tornadoes Form
Tornado formation involves a combination of ingredients: moisture, instability, lift, and wind shear that organize storms and create rotating updrafts. Many strong tornadoes develop from supercells, which are thunderstorms with a long‑lived, rotating updraft called a mesocyclone.
In a typical scenario, low‑level wind shear creates horizontal tubes of spinning air that are tilted vertically by the storm updraft; the resulting vertical rotation can intensify, tighten, and extend toward the ground as a tornado. Other tornadoes can form from line segments, QLCS structures, or along boundaries, sometimes with more subtle visual clues and shorter lifetimes.
Supercell Tornadoes
Supercell tornadoes are often the strongest and longest‑lived, sometimes producing long damage paths and higher‑end Enhanced Fujita (EF) ratings. Spotters may see a rotating wall cloud, inflow bands, and a persistent rain‑free base on the updraft side of the storm.
These storms frequently exhibit strong rear‑flank downdrafts, well‑defined structure, and distinct radar signatures such as hook echoes and velocity couplets. However, visual clues can be obscured by rain, dust, or low clouds, and safe distances must always be maintained.
Non‑Supercell Tornadoes
Non‑supercell tornadoes include landspouts and gustnadoes, which can still produce damage but often form differently than classic supercell tornadoes. Landspouts typically develop along converging boundaries, sometimes under growing cumulus or developing storms, and may be more narrow and rope‑like.
Gustnadoes are short‑lived vortices along gust fronts that may loft dust and cause minor damage, but they often lack a connection to the cloud base and are not true tornadoes. Distinguishing these features is an important part of advanced spotter training.
Tornado Climatology & Where They Occur
Tornadoes have been documented in every U.S. state and in many countries worldwide, with the highest frequency found across parts of the central United States often referred to as “Tornado Alley.” Another active region, sometimes called “Dixie Alley,” extends across portions of the Southeast.
Here is a map of recorded tornado outbreaks in the United States. Notice EF5 tornadoes can occur almost anywhere; some, like the Joplin, Missouri tornado on May 22, 2011, do not follow the general track of severe storms.
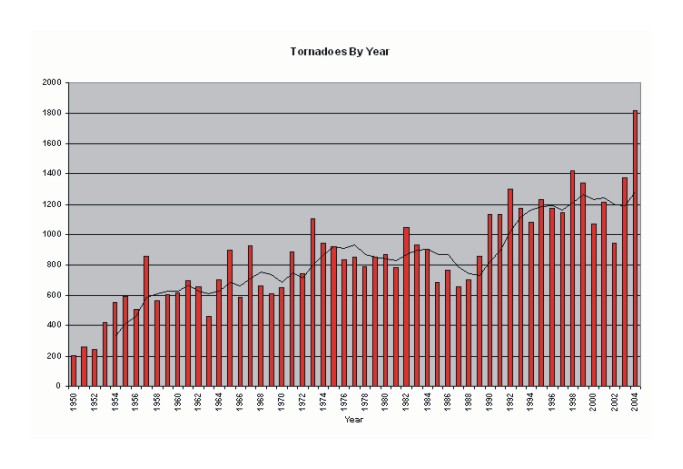
Modern tornado records in the United States extend back to 1950, providing more than 60 years of data for climatological maps and seasonal statistics. These records show pronounced seasonal cycles, with spring and early summer peaks in many areas and secondary peaks in some regions during the fall.
Population & Reporting Bias
Tornado climatology is influenced by where people live and report weather, since most historical data come from spotters, emergency officials, and the public rather than instruments. Remote areas may have missed or under‑reported tornadoes, especially earlier in the record.
To reduce some of these biases, many climatology maps focus on “days with severe weather” for a given area rather than the exact number of reports. This approach emphasizes how often an area experiences severe storms rather than how many individual reports are logged in databases.
From Fujita to Enhanced Fujita
The original Fujita Scale, introduced by Dr. T. Theodore Fujita in 1971, categorized tornadoes by intensity and area using damage to estimate wind speeds. It became the backbone of the U.S. tornado database from 1950 onward.
Over time, limitations became apparent, including subjectivity, lack of construction differences, and overestimation of extreme wind speeds. Engineers and meteorologists studied events such as the Jarrell, TX (1997) and Moore, OK (1999) tornadoes and recommended improvements, eventually leading to the Enhanced Fujita (EF) Scale.
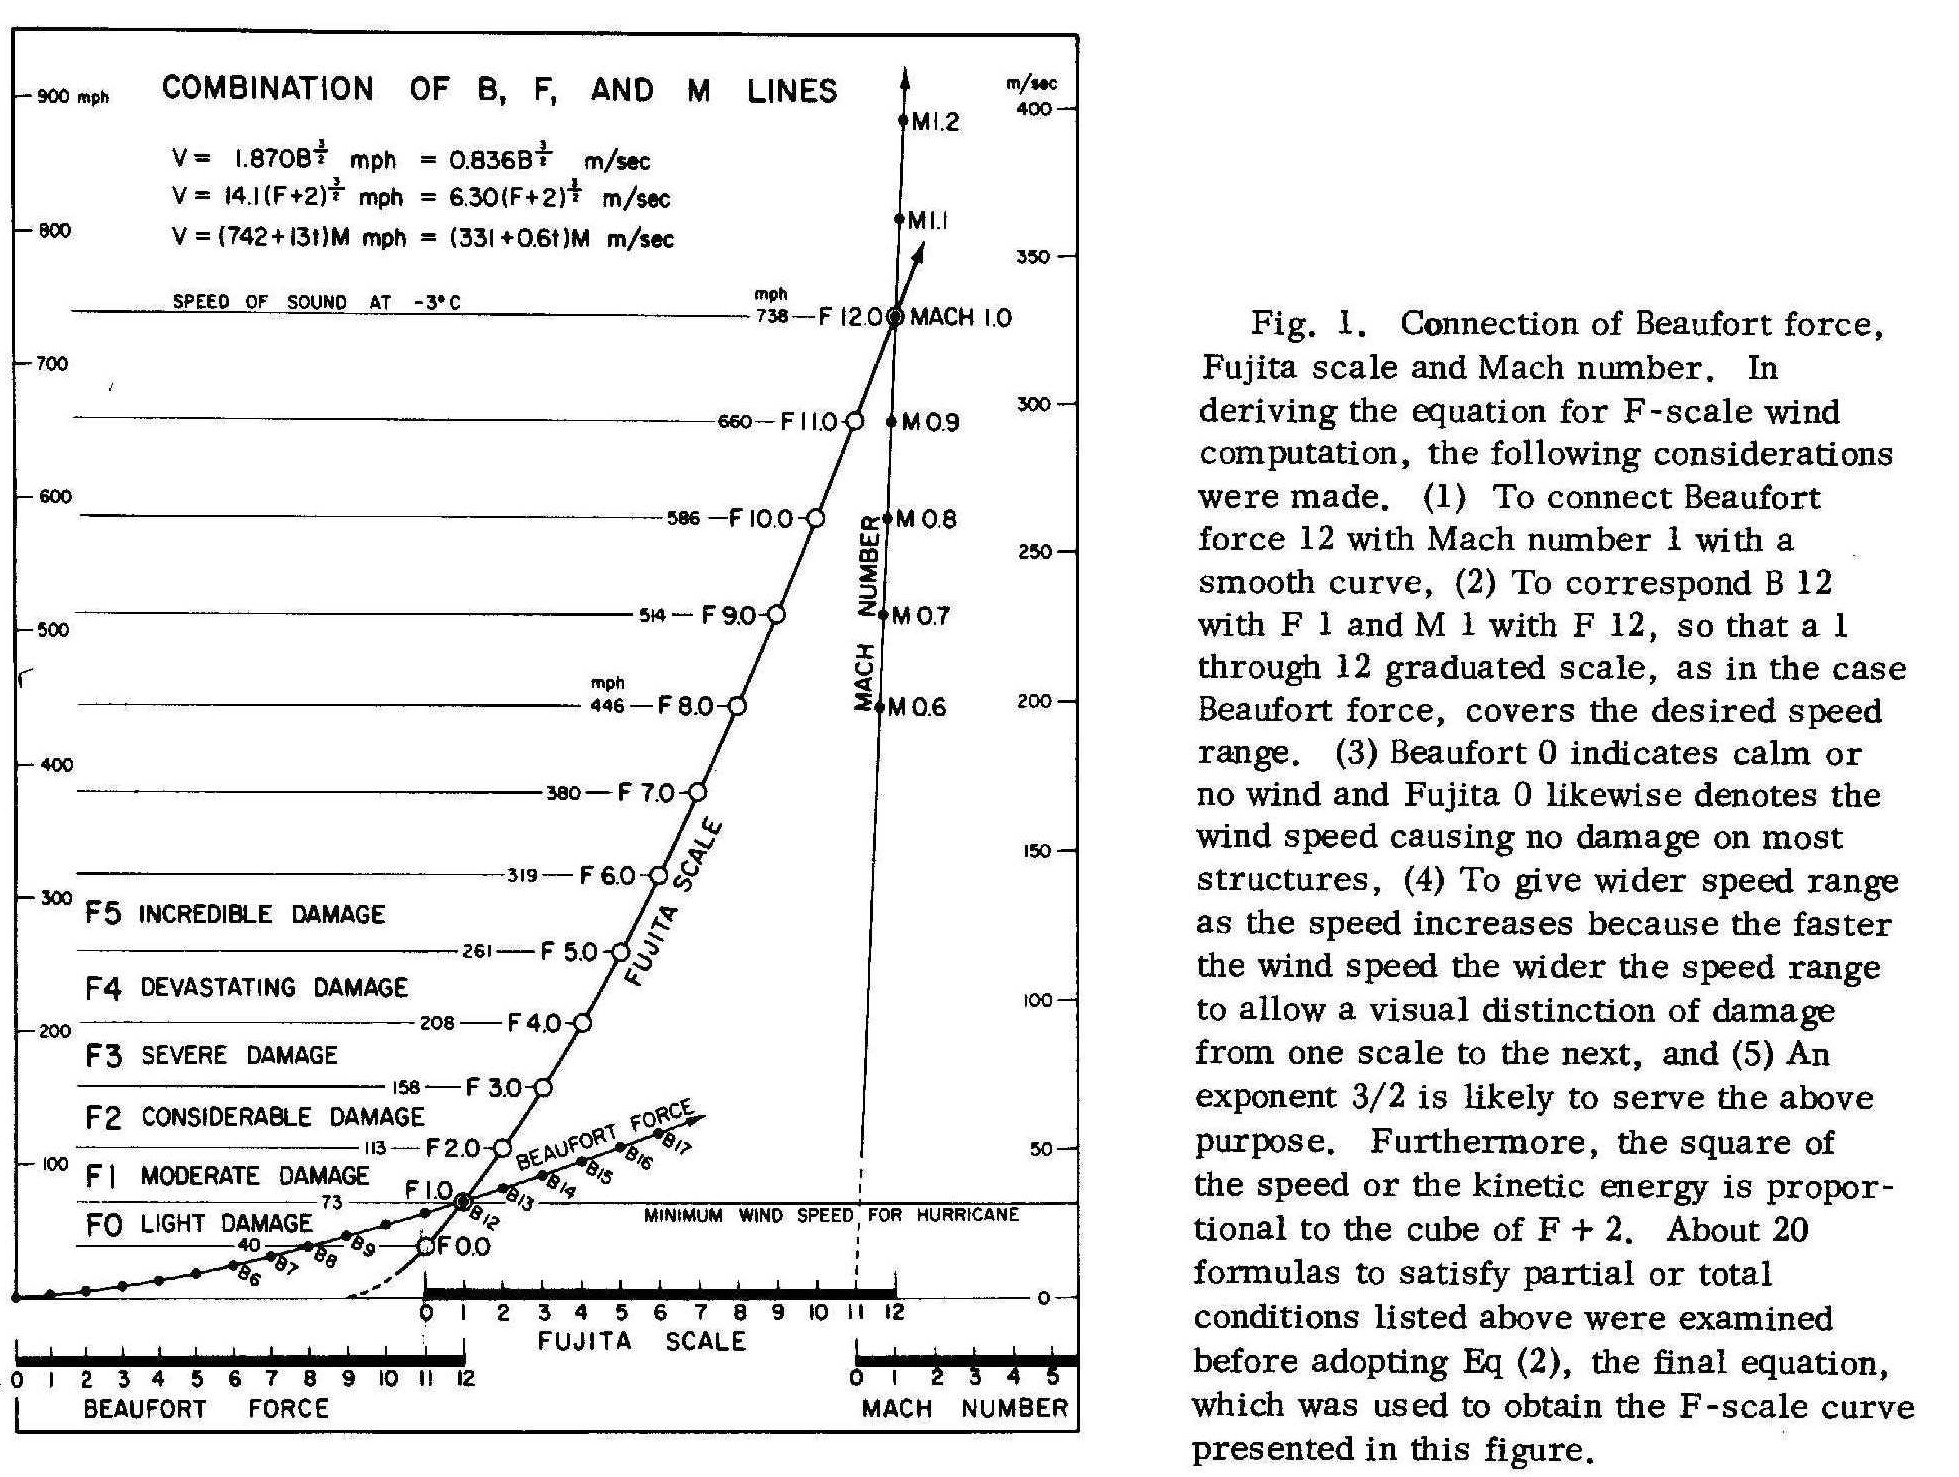
The Fujita Scale
The Fujita Scale used damage to relate to the fastest 1/4‑mile wind at the height of a damaged structure and was designed to connect with both the Beaufort Scale and the Mach number scale.
- F0 (Gale)
- F1 (Weak)
- F2 (Strong)
- F3 (Severe)
- F4 (Devastating)
- F5 (Incredible)
Fujita later proposed a “Modified” Fujita Scale to better account for structural differences, combining observed damage with construction type to refine ratings.
Measuring Tornado Strength: The EF Scale
Tornado strength in the United States is rated using the Enhanced Fujita (EF) Scale, which classifies tornadoes from EF0 to EF5 based on observed damage and estimated wind speeds. Ratings are assigned after the event by survey teams that inspect structures, vegetation, and other damage indicators.
The EF Scale focuses on what tornado winds do, rather than direct wind measurements, because reliable instrumented data near tornadoes are rare. Even an EF0 tornado can cause injuries or localized damage, while EF3–EF5 tornadoes can be devastating to well‑built homes and infrastructure.
EF Scale Overview
- EF0: Weak; light damage such as broken branches and minor roof damage.
- EF1: Moderate damage; mobile homes overturned, roof surfaces peeled, outbuildings damaged.
- EF2: Considerable damage; roofs torn off well‑constructed houses, large trees snapped or uprooted.
- EF3: Severe damage; entire stories of well‑constructed houses destroyed, heavy cars lifted and thrown.
- EF4: Devastating damage; well‑built homes leveled, structures with weak foundations blown away.
- EF5: Incredible damage; strong frame houses swept from foundations and debris carried long distances.
Despite its usefulness, the F‑Scale was subjective, based solely on damage, difficult to apply with no damage indicators, and tended to overestimate wind speeds above F3.
The Enhanced Fujita Scale
The Enhanced Fujita Scale was developed to provide more consistent assessment of damage, maintain continuity with the original database, and include detailed damage indicators (DIs) and degrees of damage (DODs).
Survey teams begin with 28 Damage Indicators (such as one‑ or two‑family residences, manufactured homes, trees, and other structures), then assign a Degree of Damage with associated lower‑bound, upper‑bound, and expected wind speeds. The resulting wind estimate is mapped to an EF rating.
For example, if a tornado causes most walls on the bottom floor of typical brick veneer homes (DI #2, FR12) to collapse (DOD 8), the expected wind speed would be around 152 mph, leading to an EF3 rating on the EF Scale.
Go to the WDTB EF‑Scale training course for more information, and see the original Enhanced Fujita Scale document at Texas Tech National Wind Institute .
Tornado Safety: Before, During & After
Knowing what to do before, during, and after a tornado is essential for reducing risk to you and your family. A simple, practiced plan can make the difference in fast‑moving situations where seconds count.
Before a Tornado
- Identify your safest shelter location at home, work, and school: a basement, storm shelter, or interior room on the lowest floor.
- Have multiple ways to receive warnings, including NOAA Weather Radio, phone alerts, and local media.
- Prepare an emergency kit with water, non‑perishable food, sturdy shoes, flashlights, and necessary medications.
- Practice your plan with family or coworkers so everyone knows where to go and what to do.
During a Tornado Warning
- Go immediately to your pre‑identified shelter: basement, interior bathroom, closet, or hallway away from windows.
- Get under sturdy furniture and protect your head and neck with helmets, cushions, or blankets.
- Avoid windows, large open rooms (like gyms or auditoriums), and exterior walls.
- If in a mobile home or vehicle and you have time, move to a substantial building or designated shelter; mobile homes are not safe during tornadoes.
After the Tornado
- Watch for downed power lines, gas leaks, and structural damage before re‑entering buildings.
- Listen to local officials for information on additional storms, hazards, and recovery resources.
- Provide first aid if you are trained, but avoid moving seriously injured people unless they are in immediate danger.
- Document damage safely and consider sharing verified reports with local authorities and the NWS when requested.
Storm Spotting & Tornado Identification
SKYWARN® spotters provide critical “ground truth” that complements radar and satellite data during severe storms. Trained spotters learn to distinguish real tornadoes from look‑alikes and to report hazards accurately and safely.
Visual Clues of a Tornado
- A persistent, rotating wall cloud beneath the updraft base of a thunderstorm.
- A funnel extending downward from the wall cloud or base, sometimes partially wrapped in rain or dust.
- A rotating debris cloud at the ground, even if the funnel is not clearly visible.
- Rapid changes in wind, rising motion into the storm, or a sudden onset of intense rain, hail, or wind as circulations move nearby.
Tornado Look‑Alikes
Many features can resemble tornadoes at a glance, including rain shafts, scud clouds, smoke plumes, and dust columns. These features often lack organized, persistent rotation and a well‑defined debris cloud near the ground.
Spotters are trained to watch suspected features for a minute or more, looking for consistent rotation and a connection between the cloud base and any debris at the ground. When in doubt, report what you see using clear, neutral descriptions and let forecasters interpret the information in context.
Spotter Safety Around Tornadoes
- Keep a safe distance from storms and never position yourself in the projected path of a tornado.
- Always have at least two escape routes and avoid dead‑end roads and low‑lying areas prone to flooding.
- Do not spot from mobile homes or lightweight structures; seek substantial shelter if storms approach.
- Remember that your safety comes first; if you feel threatened, stop spotting and go to shelter.
Reporting Tornadoes & Severe Weather
Accurate, timely reports help warning forecasters confirm radar signatures and communicate specific threats to the public. When you report, include what you observed, where, when, and any impacts.
What to Report
- Confirmed tornadoes and funnel clouds, including location, direction of movement, and approximate size.
- Wind damage such as snapped trees, power lines down, overturned vehicles, or damaged structures.
- Hail size using common objects (e.g., pea, marble, quarter, golf‑ball) or direct measurements when safe.
- Flooding, reduced visibility, and significant dust, debris, or other hazards associated with storms.
How to Report
- Use local SKYWARN® and NWS phone numbers or amateur radio nets established for severe weather.
- Submit reports through the national NWS Storm Report Form when available for your area.
- Follow instructions from your local NWS office or SKYWARN® program on using social media for public reports.
Additional Learning & Resources
Many free resources are available for learning more about tornadoes, severe weather safety, and storm spotting. These materials can support classroom instruction, emergency planning, and advanced training for SKYWARN® volunteers.
- NWS Tornado Safety Page – Comprehensive safety guidance and preparedness information.
- SKYWARN Spotter Field Guide – Visual examples and reporting guidance for storms and tornadoes.
- Basic Spotter's Field Guide (PDF) – Training material for new spotters.
- Tornado Safety Tips (PDF) – Printable safety sheet for homes and schools.